The Office of Institutional Effectiveness has created a series of interactive dashboards that are publicly accessible and contain official data points for MSU Texas. Click on an image card below to view the full size report.
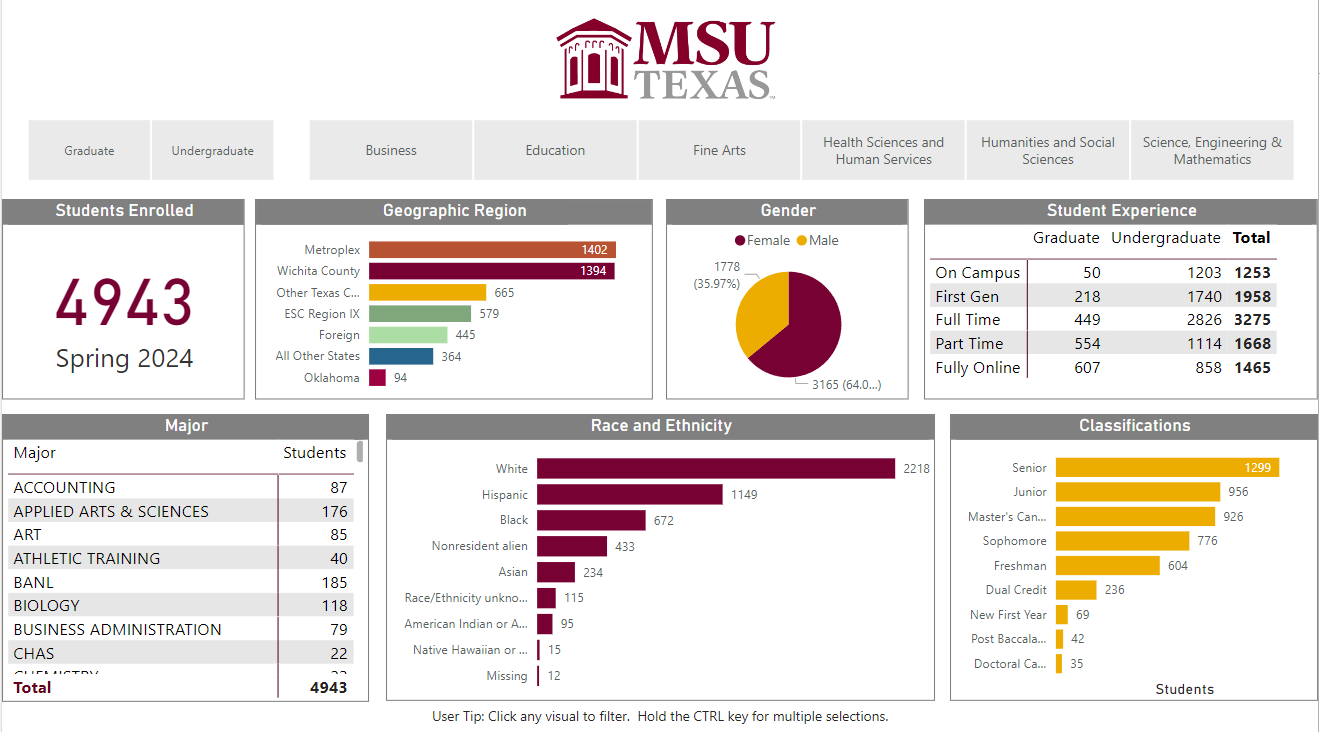
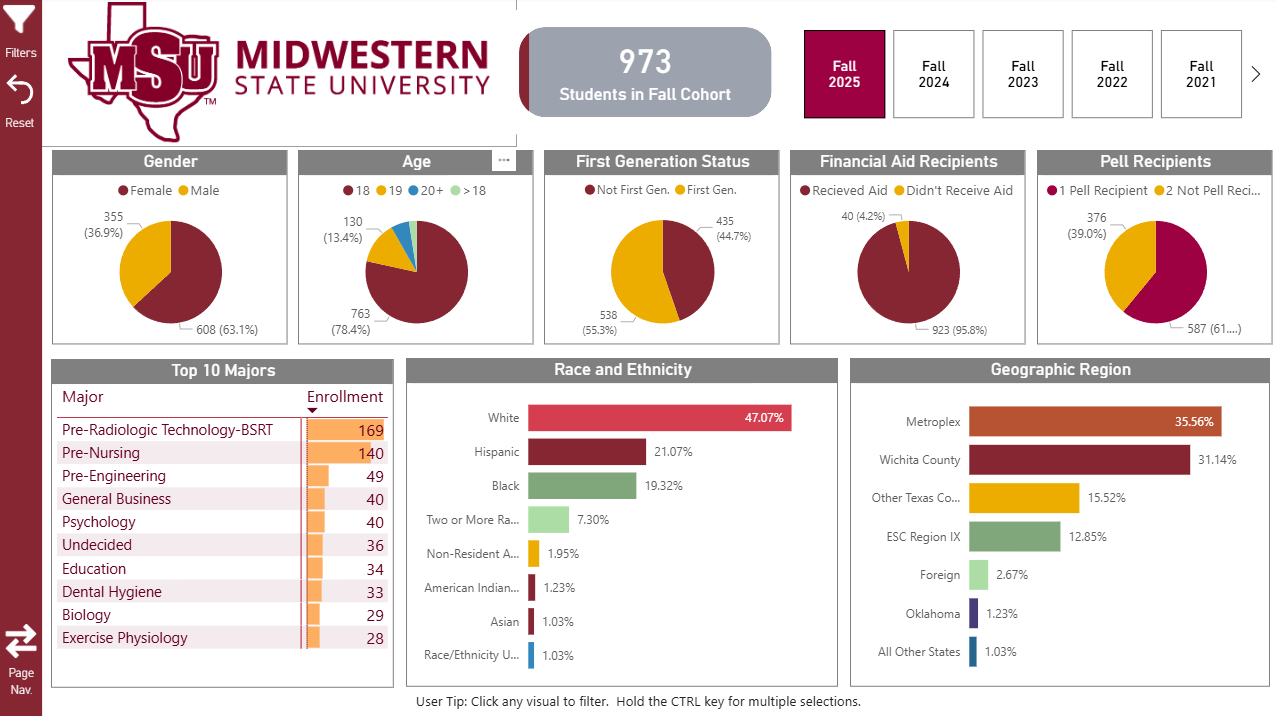
- Semester Enrollment - Provides the total number of students enrolled by various demographics including geographic region, legal sex, major, race/ethnicity, classification, etc. This dashboard is updated each long semester after 20th day.
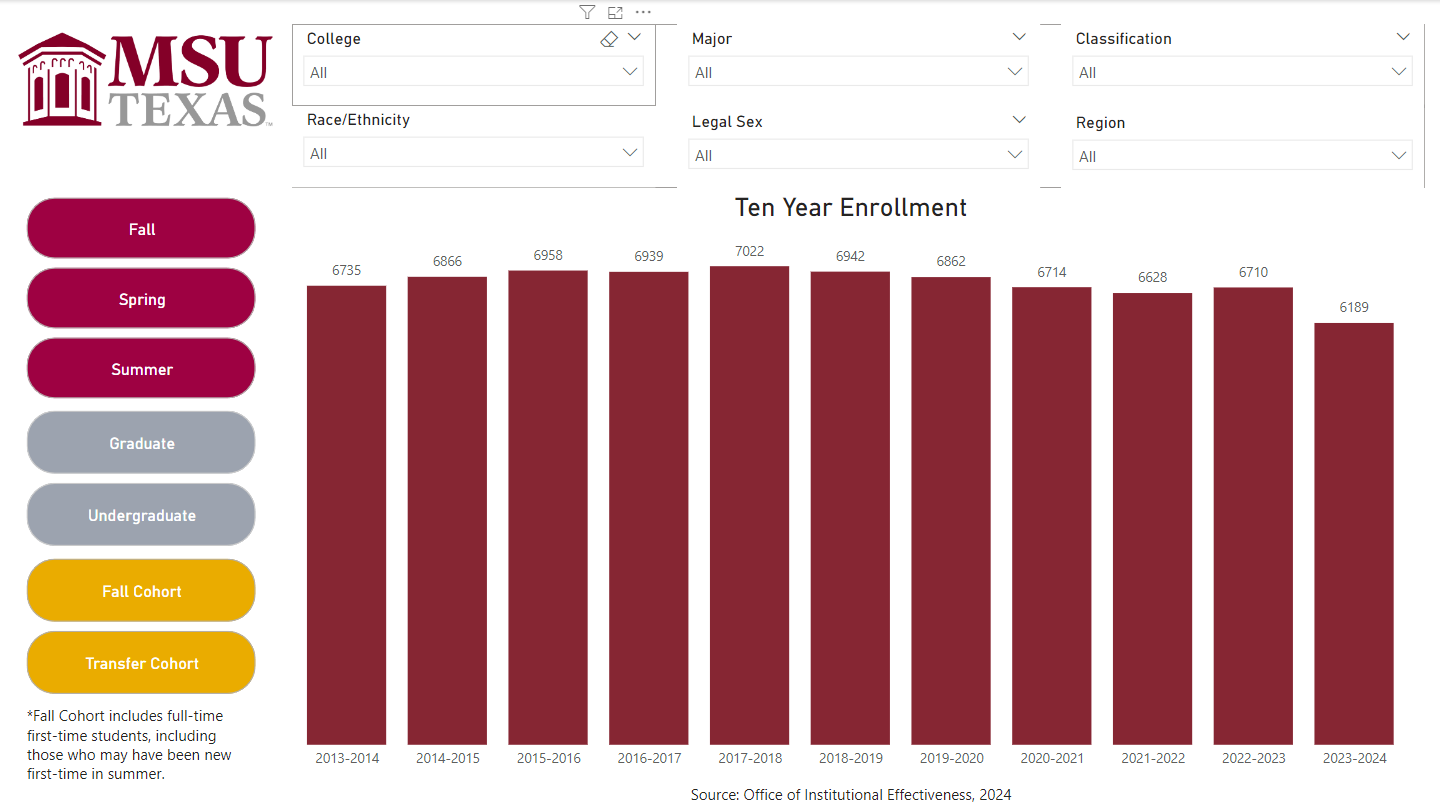
- 10-Year Enrollment - Provides the total number of students enrolled over the last ten years, as well as a demographic breakdown by geographical region, race/ethnicity, and legal sex. This dashboard is updated each long semester after 20th day.
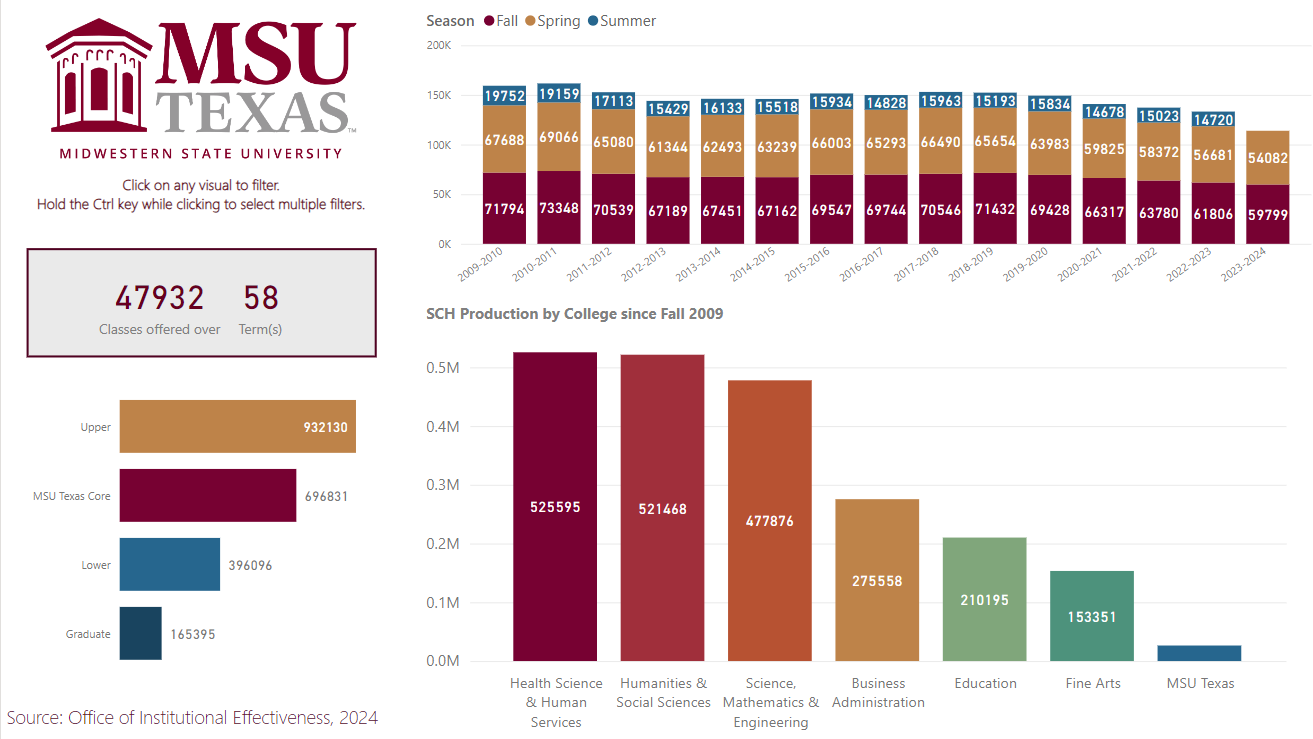
- Semester Credit Hour Production - Breaks down semester credit hour production by college, term, and course subject. This dashboard is updated each semester after 20th day.
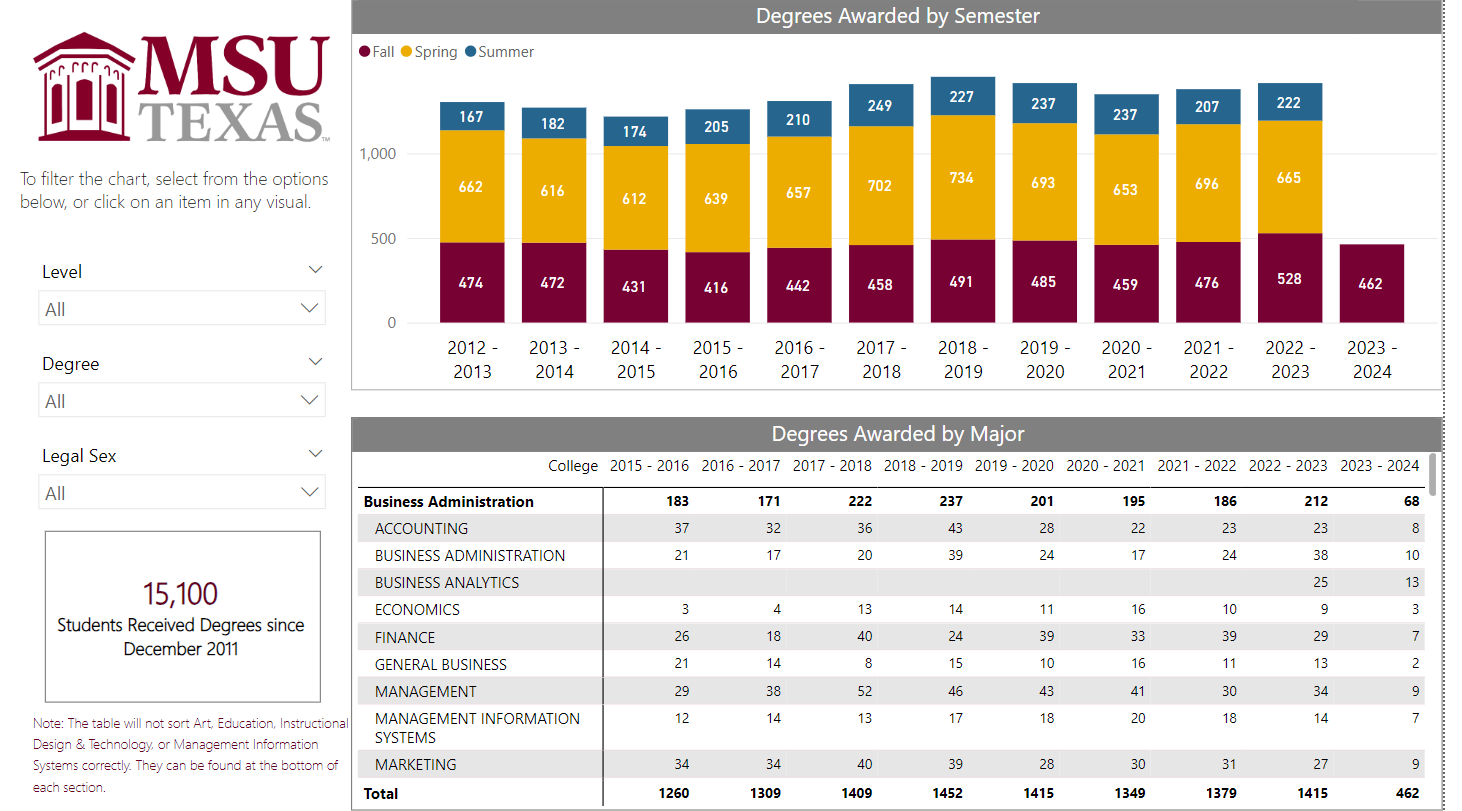
- Degrees Awarded - Lists the number of degrees awarded by term, major, and degree type.
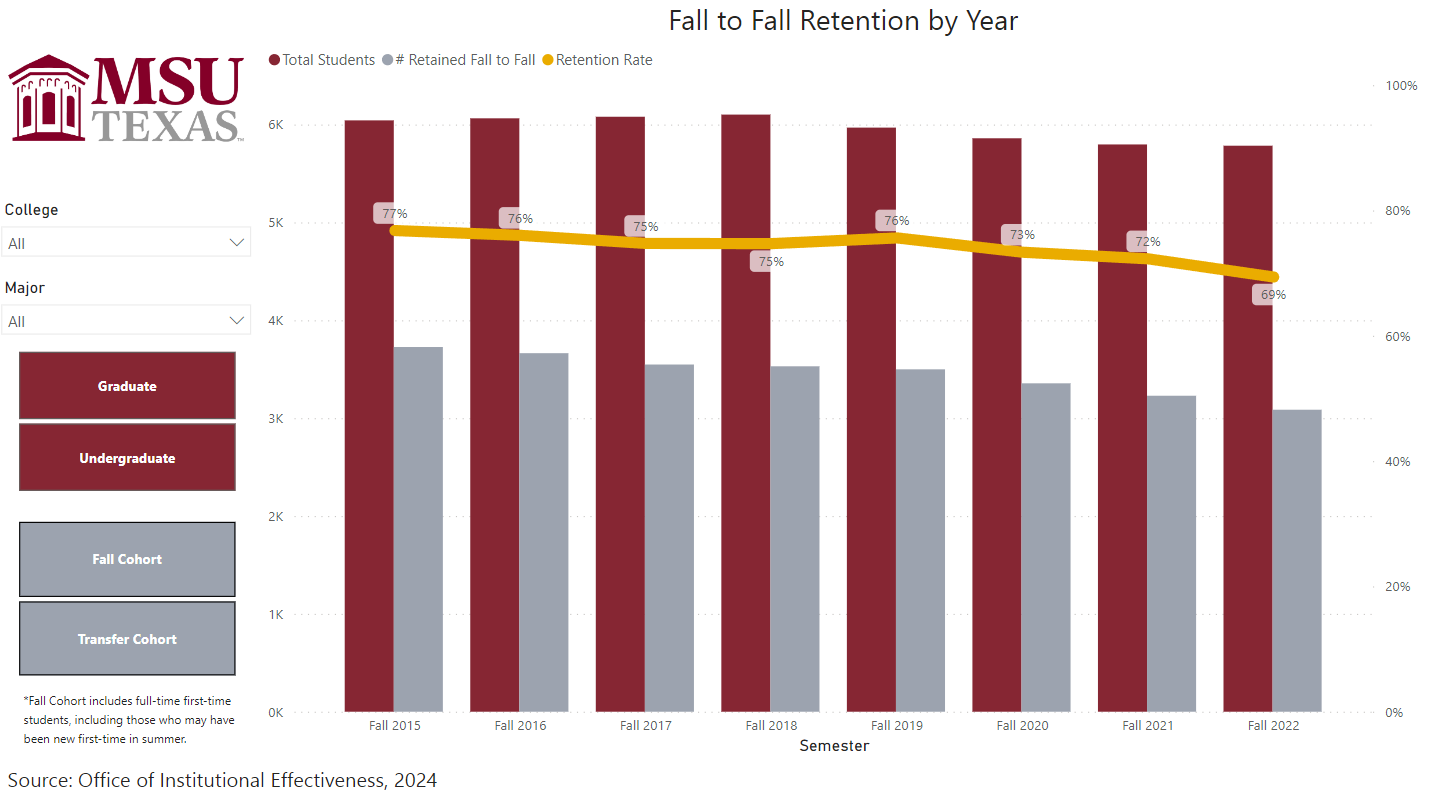
- Retention - Provides the total number of students retained from fall to fall and fall to spring. Filters include cohort type and level.
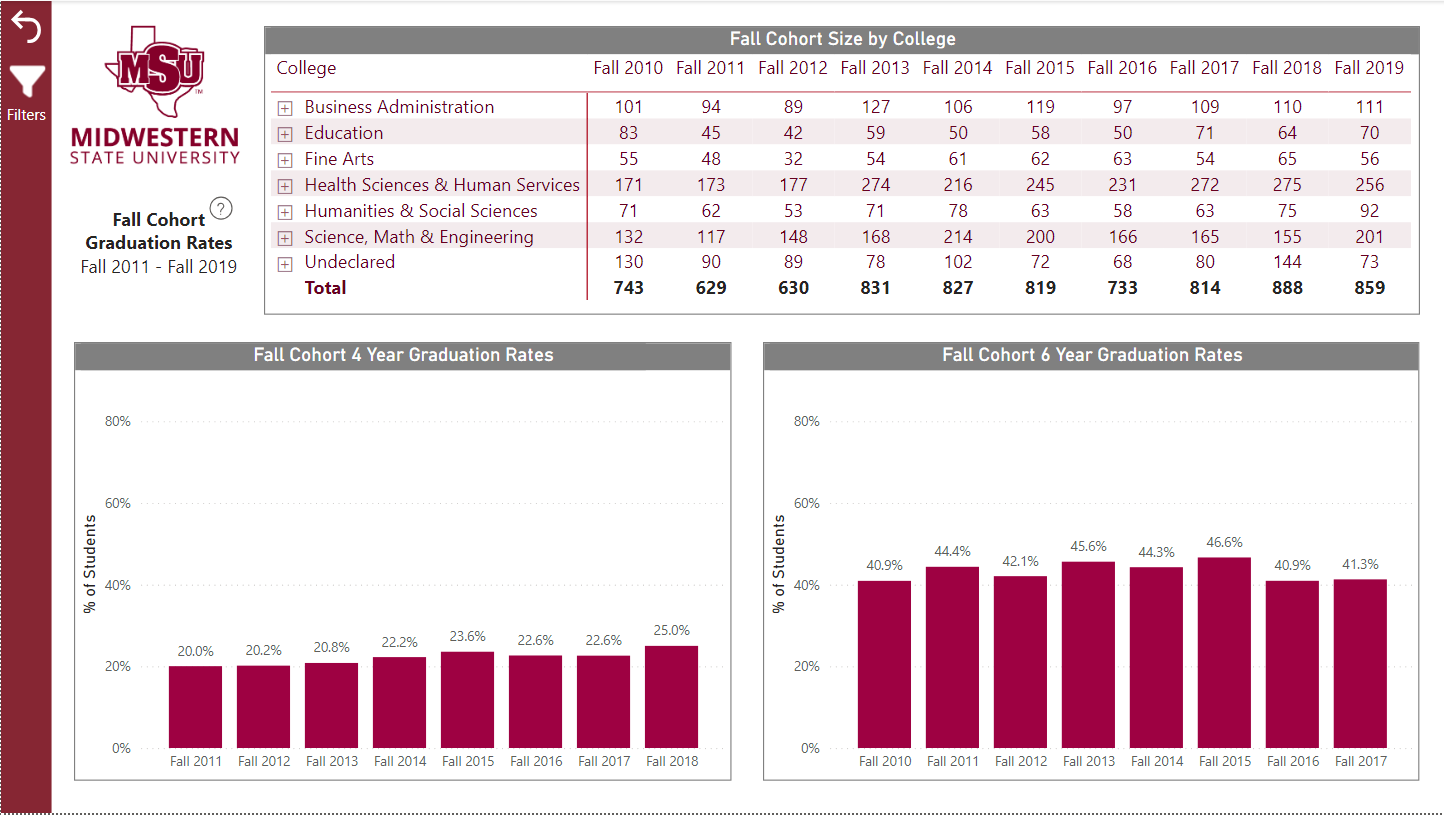
- Graduation Rates - Breaks down graduation rate trends by college, major, and various other demographic categories.
The following list of dashboards are only available to MSU Texas faculty and staff that are logged into their 365 accounts and have already been added to the Student Success workspace within PowerBI. If you would like to request access to one of these reports within the workspace, or would like to request that a new report be made, please email institutional.effectiveness@msutexas.edu.
- Daily Enrollment - Compares enrollment head counts with the previous two years based on the number of days out from the first day of class. This report is run daily from when registration opens through 20th day (link).
- Retention Tracking (Fall to Fall) - Compares year over year enrollment growth and retention differences by classification, college, major, and region. This report only tracks the number of student retained from semester to semester - it does not track total enrollment. This report is run weekly from when registration opens through 20th day (link).
- Retention Tracking (Fall to Spring) - Compares year over year enrollment growth and retention differences by classification, college, major, and region. This report only tracks the number of student retained from semester to semester - it does not track total enrollment. This report is run weekly from when registration opens through 20th day (link).
- Retention Tracking (Spring to Fall) - Compares year over year enrollment growth and retention differences by classification, college, major, and region. This report only tracks the number of student retained from semester to semester - it does not track total enrollment. This report is run weekly from when registration opens through 20th day (link).
- Weekly Admissions & Enrollment - Compares year over year applications, admissions, and enrollments by admissions type, level, and college. This report does not include continuing students, only newly admitted and re-enrolling (link).
- Enrollment, Retention, Attrition - Provides enrollment and fall-to-fall retention/attrition data for the fall and transfer cohorts, as well as the wider undergraduate and graduate populations. This data is also disaggregated by race/ethnicity and geographical region. This report is updated annually (link).
In addition to following the links above, those with access can navigate to the Enrollment and Retention workspace by following the instructions below:
- Navigate to PowerBI and sign-in using your MSU Texas login credentials.
- Once in PowerBI, Click on "Workspaces" toward the bottom of the vertical bar on the left and then choose the "Student Success" workspace.
- From there, you may want to use the filter in the top right to select only Folders and Reports. Otherwise, click on the icons that look like bar graphs to access the report dashboards.